Satellite Imagery Property Analysis: How Aerial and Satellite Data Are Reshaping Property Valuation and Planning
Property professionals have long relied on site inspections, surveys, and tabular data. But integrating satellite and aerial imagery into property analysis is producing measurable improvements—particularly in Australia, where high-resolution imagery coverage now reaches up to 95% of the population.
Recent Australian research demonstrates that fusing aerial and street-level imagery with traditional property data reduces valuation error by nearly 30%. The question is no longer whether imagery adds value, but how to operationalise it.
What is satellite imagery property analysis?
Satellite imagery property analysis uses remotely sensed visual data—from satellites, aircraft, or drones—to extract insights about land and buildings. Combined with machine learning, this imagery captures property-level attributes that traditional datasets miss.
Data sources
Satellite imagery provides broad coverage and regular revisit frequencies. Providers like Planet Labs and Maxar deliver imagery ranging from daily global coverage to sub-metre resolution.
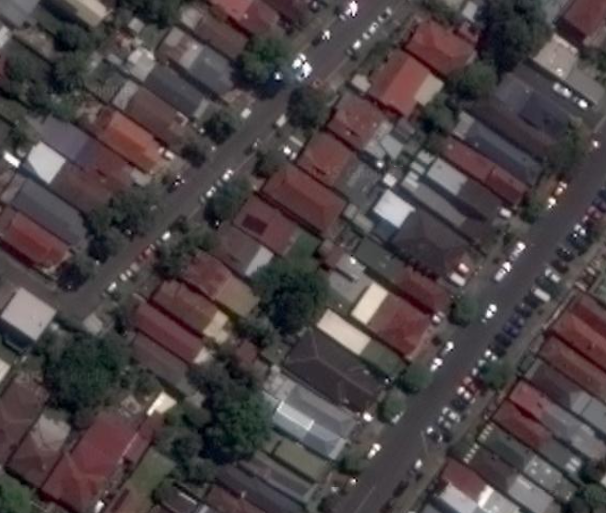
Aerial and oblique imagery offers higher resolution. In Australia, Nearmap captures vertical and angled imagery multiple times per year, revealing roof conditions, building facades, and features obscured in top-down views.
Street-level imagery provides ground-level perspectives. Research shows street-view images capture neighbourhood amenity and building presentation cues that correlate with property values.
How imagery improves property valuation
A 2024 study by Hoang et al. tested aerial and street-view imagery integration on a Brisbane dataset of 34,399 sales and 320,000+ images. Result: 28.35% reduction in RMSE compared to traditional variables alone.
Features that matter
- Roof condition and materials provide signals about maintenance and quality not captured in property databases.
- Vegetation and tree canopy derived from spectral analysis (NDVI) correlates with values in Australian urban contexts.
- Building footprint changes detected through change analysis identify additions not reflected in council records.
- Sky view indices from street-level imagery capture visual amenity that influences buyer preferences.
Imagery for planning and compliance
Detecting unapproved works
Councils face a persistent challenge: verifying built outcomes match approved plans. Time-series imagery offers an alternative to complaint-driven inspections. Comparing captures can flag properties where footprints expanded, pools appeared, or vegetation cleared—triggering targeted reviews.
For buyers, the same approach identifies unapproved works before settlement. A pool in 2019 imagery that isn't on the s10.7 certificate raises questions worth investigating.
Planning due diligence
- Setback verification: Measuring building-to-boundary distances from calibrated imagery confirms compliance.
- Site coverage calculation: Extracting footprint, driveway, and paved areas enables impervious surface calculations.
- Encroachment detection: Overlaying cadastral boundaries on imagery reveals structures extending beyond property boundaries.
Satellite vs aerial: choosing the right source
| Factor | Satellite | Aerial |
|---|---|---|
| Resolution | 30cm to several metres | 5–10cm |
| Coverage | Global | Urban/peri-urban (AU) |
| Update frequency | Daily–monthly | Several times yearly |
| Oblique views | No | Yes |
| Cost | Variable; some free | Commercial subscription |
Hybrid approaches work well: satellite for broad screening, aerial for detailed assessment.
The economic case
A 2024 ACIL Allen report estimated modern geospatial services increased Australian GDP by $38.6 billion in 2023–24. The ANZ geospatial analytics market is estimated at ~USD $740 million for 2025.
PlotDetect brings together zoning, environmental constraints, DA history, and DCP provisions for 3.5M+ NSW properties—and we're integrating imagery-derived insights into planning and compliance analysis.